











2025 Geography of Payer Enrollments Report
Payer timelines, state by state
What 64K+ enrollment records reveal and how it should shape your 2026 planning — how approval timelines vary by state, and what it means for providers, payers, and patients.
Key takeaways
The data is in
In our analysis of more than 64,500 enrollment submissions across all 51 states and territories, we found major differences in how long it takes to get a provider billable. On the low end, the weighted median in Hawaii is 32 days; on the high end, Delaware's 90th percentile reaches 196 days.
The national picture
Median provider enrollment turnaround, state by state
Weighted median submission-to-completion, in days. Timelines are rounded from source data for easier comparison.
Fastest state
Hawaii · 32 days
Slowest (90th percentile)
Delaware · 196 days
At the higher end of the curve, some providers are waiting nearly six months. In states like Delaware (196 days at the 90th percentile) and Michigan (175 days), outliers push timelines far beyond the median — months of capacity locked out of circulation.
Where delays run deepest
The longest waits stretch to 3+ months
Some of the longest waits are in Vermont, Michigan, New Mexico, North Dakota, and South Dakota, where the weighted median stretches to 3+ months.
Delays are felt the most in rural-heavy states. North Dakota, South Dakota, Vermont, and Montana all report weighted median enrollment times exceeding 85–90 days. These states already face access challenges — long distances, fewer providers, and underserved populations. Long enrollment timelines only add another barrier for patients who can least afford it.
Many of these states lack centralized payer systems.
Providers must often work through fragmented regional or multi-plan networks.
Multiple, parallel enrollment processes pile on time and effort.
As a result, providers in these states are sidelined, unable to see patients, while revenue stalls for both clinicians and systems.
Not all high-volume states are slow
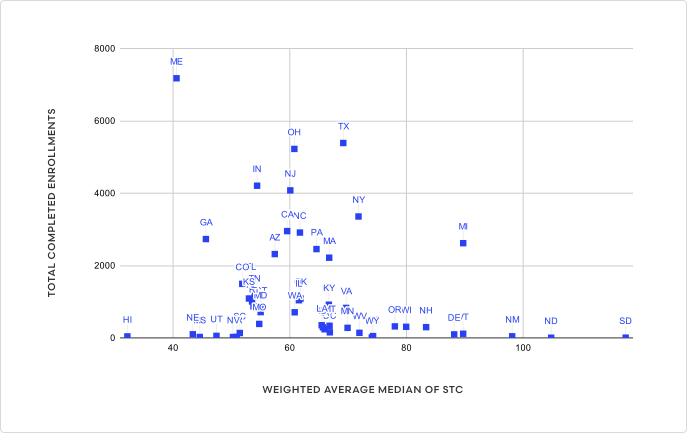
Maine proves the opposite
A Health Professional Shortage Area (HPSA) is a federal designation from the Health Resources and Services Administration (HRSA), identifying communities where access to care is limited by too few providers relative to the population's needs.
Where enrollment moves fastest
Why it matters for growth
For health systems and provider groups, these fast states can become strategic launchpads for growth. As organizations evaluate where to expand, it's critical to weigh not just workforce availability and patient demand, but also the administrative speed of the market. Scaling in states with shorter enrollment timelines can translate into millions in accelerated revenue and faster access to care.
See patients sooner
New clinicians can begin billing and seeing patients sooner.
Decrease in delays
Systems can ramp up new sites or service lines more quickly.
Risk reduction
Financial risk tied to delayed reimbursement is significantly reduced.
Scale changes the stakes
Enrollment delays don't affect every state equally
When large states experience enrollment delays, the consequences scale with the size of their insured populations.
Delay impacts access
In South Dakota (~750K insured), a 90-day delay impacts access — but within a contained population.
Delay drains revenue
In Michigan, New York, or Texas, the same delay multiplies into millions of delayed patient visits and hundreds of millions in deferred revenue.
.svg)
What this means
What this all means for providers, payers, and health systems
For providers
Delays mean months of work without reimbursement.
For payers
Delays mean underutilized networks and frustrated members.
For health systems
Delays mean clinicians hired to fill shortages can't actually see patients.
Why Medallion
Why you need a partner to move faster
Medallion's scale, infrastructure, and payer expertise help eliminate resubmissions, streamline submissions, and proactively advocate with payers — the difference between waiting months for approvals and getting providers in-network, billable, and seeing patients much sooner.

Faster submissions
Automated workflows that gather provider data up front and push clean applications out the door without manual delays.

Roster-based submissions
Bulk processing to streamline large groups of providers into payer networks at once, rather than one-off applications.

AI-driven automation
Intelligent checks and validation rules that help prevent resubmissions and costly denial loops.

Direct integrations
Including CAQH, Nursys, NPDB, and more, to pre-populate data and reduce redundant provider outreach.

Economies of scale
Expert oversight from a partner who understands regional and national payer nuances across thousands of enrollments.
Cut enrollment delays.
Scale smarter.
See how Medallion gets your providers in-network, billable, and seeing patients faster.
Get in touchMethodology
This report is based on a 12-month lookback period, analyzing enrollment data from August 11, 2024 through August 12, 2025. To ensure accuracy and relevance, the dataset excludes:
- Enrollments that were canceled or paused at the request of the provider organization.
- Enrollments with multiple dependencies tied to concurrent applications with other groups or Medicare/Medicaid, which could not be individually isolated for timing analysis.
- Enrollments that fell outside the scope of Medallion's contractual agreement with the healthcare organization.
For each state, we aggregated submission-to-completion (STC) data from individual payers and calculated a weighted median turnaround time (TAT), with weights applied according to the number of completed enrollments. This ensures that states with larger volumes of data contribute proportionally more to the overall results.
Lines of business (LOBs): The analysis spans multiple payer segments, including Commercial, ACA/Marketplace, Medicare Advantage, and Medicaid. Because enrollment timelines vary significantly across these segments, state-level results reflect a blend of payer mix as well as geography. For example, states with higher concentrations of Medicaid managed care organizations tend to exhibit longer enrollment times, while commercial-dominant markets often process enrollments more quickly.